Young Platform
Profit and Loss: how to monitor your crypto portfolio performance on Young Platform
Jacqueline Nieder
5 min

Managing performance with the new P&L calculation method
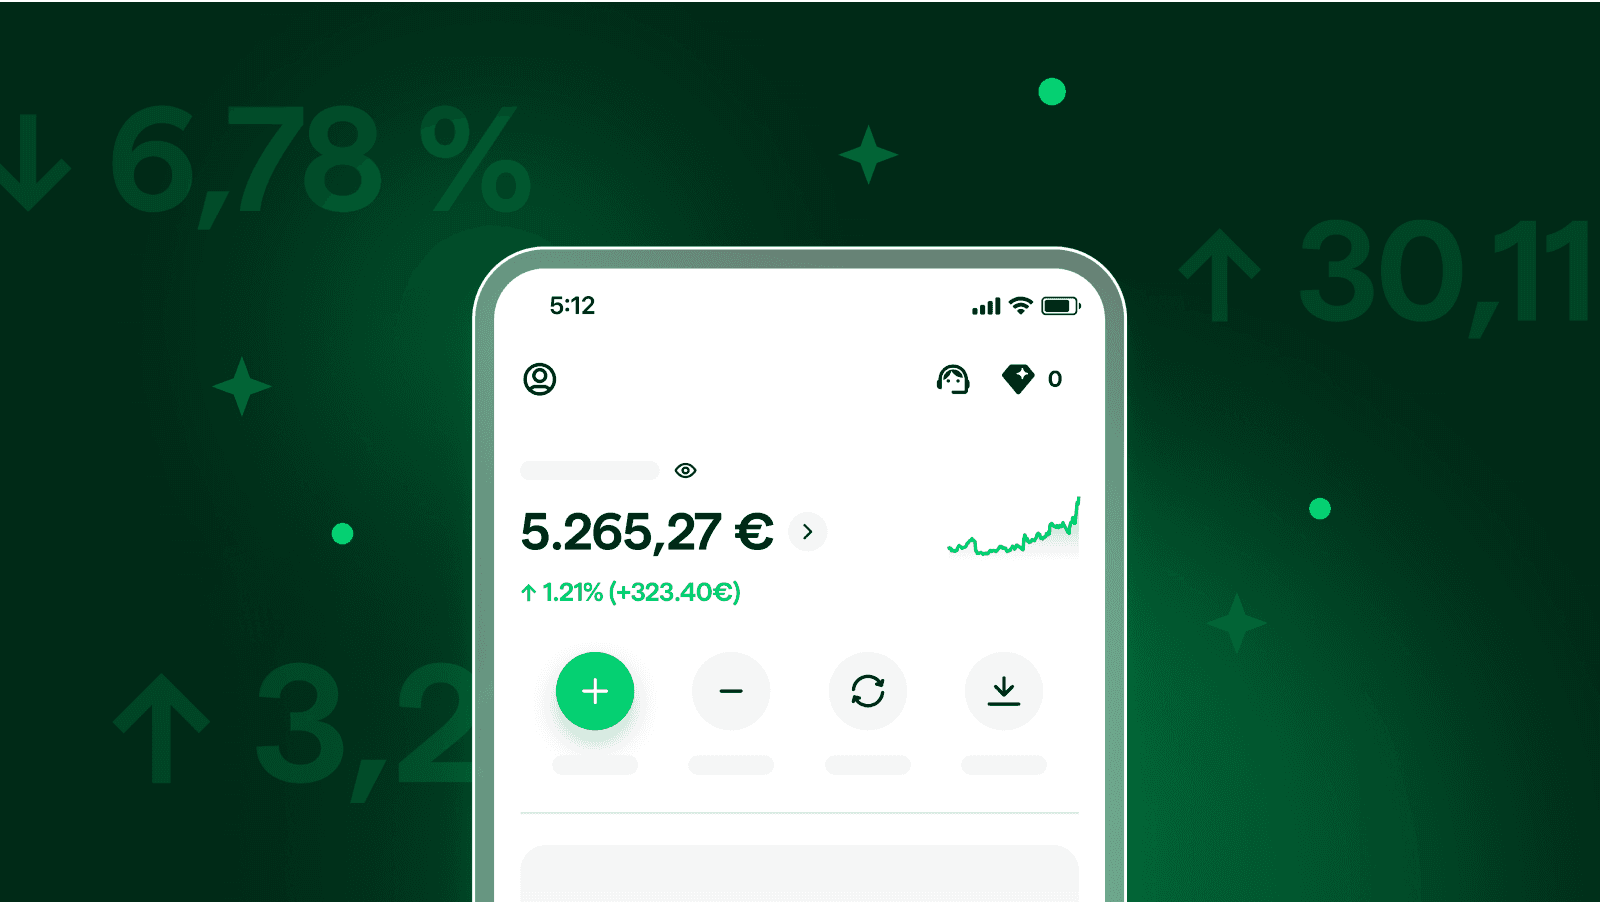
Young Platform has updated its P&L (Profit & Loss) feature to offer a clearer and more detailed view of your crypto portfolio’s performance. As of June 2025, the system employs a new calculation method, which features interactive charts, detailed statistics, and revised data handling.
This is not a brand-new feature, but rather an optimisation of how existing data is analysed. It allows users to easily track:
- Overall portfolio performance
- Gains or losses on each individual cryptocurrency
- Current value across the various wallets (Main, Savings, Staking, Smart Trade)
- Realised and unrealised performance over time
To view your updated data, simply go to the “Profit and Loss” section within the app or web platform.
P&L method and tax reporting
The new calculation method is now also used to generate the tax report available on the platform. This integration ensures that the data shown in the P&L section is fully aligned with what is needed for income tax reporting.
Main user benefits include:
- Consistency between operational analysis and tax data
- Realised gains calculated in accordance with current regulations
- Easy-to-export tax report, readable by your accountant
This synergy between performance tracking and regulatory compliance streamlines crypto asset management from both financial and legal perspectives.
How the P&L calculation works
Young Platform distinguishes between realised and unrealised gains and losses.
Realised Profit (or Loss)
This refers to the actual gain or loss made from completed operations: sales, withdrawals, or conversions into euros or stablecoins.
Learn more about stablecoins and taxation: Crypto-assets: from MiCAR to the Italian tax system
Calculation:
Sale/withdrawal/conversion price – average purchase price
Fees are included and counted as a loss.
Note:
Conversions between cryptocurrencies (e.g., BTC > ETH) do not count as realised gains, but transfer their value as unrealised capital gains.
Conversions to stablecoins (e.g., BTC > USDC), however, do count as realised gains, just like conversions into euros.
Example:
- Purchase: 0.5 BTC at €15,000 (€30,000/BTC)
- Sale: 0.5 BTC at €17,500 (€35,000/BTC)
- Realised profit: €2,500
Unrealised Profit (or Loss)
This is an estimate of the value change of cryptocurrencies still held in your portfolio.
Calculation:
Current value – average purchase price
Note:
Applies only to crypto assets that have not yet been sold, withdrawn, or converted into euros/stablecoins.
Conversions between cryptocurrencies retain the gain as an unrealised capital gain.
Example:
- Purchase: 0.5 BTC at €15,000
- Current value: €17,500
- Unrealised profit: €2,500
Average purchase price: definition and usage
The average purchase price represents the unit cost of a cryptocurrency over time.
Key features:
- Updated only when buying
- Unaffected by sales, withdrawals, or conversions
- Used to calculate both realised and unrealised profits
- When transferring assets between internal wallets (e.g. from Savings to Staking), the average purchase price follows the asset
How to read the data in the Analytics section
The Analytics section has been enhanced to provide a clear and detailed overview of your portfolio’s structure and performance. It includes:
Total performance
Total performance shows the overall gains and losses in your portfolio, expressed both as a percentage and in euros. It takes into account all value fluctuations, including realised and unrealised gains and losses.
Figures are updated every hour and shown net of any fees.
This metric provides an immediate and accurate snapshot of your portfolio’s growth or decline, making it a crucial reference for evaluating overall performance.
Breakdown by functionality
This section displays how your capital is distributed across the various investment strategies available on Young Platform: Main Wallet, Savings, Staking, and Smart Trade.
For each, it shows the total unrealised gain, allowing you to quickly identify which strategy is delivering the best results.
Volume analysis
This tool lets you monitor your activity in detail: deposits, withdrawals, and orders (buy, sell, or swap). You can select a specific time frame and filter by transaction type, generating a detailed chart of your operations.
This enables complete control over your activities and supports more strategic decision-making.
Crypto distribution
Displayed via a pie chart, this section shows the percentage breakdown of your crypto holdings by asset.
Each segment represents a specific cryptocurrency, helping you visually assess the weight of each asset and decide whether to rebalance your portfolio.
Transactions
Here, you’ll find a detailed list of all your transactions, including type and volume.
This view is also useful if you’re considering upgrading your verification level or joining a Club plan that offers reduced fees based on your trading volume.
Balance distribution
This chart shows how your capital is allocated across different investment strategies on the platform.
Each segment represents a strategy and highlights its proportion of your total balance.
It’s a valuable tool for evaluating diversification, exposure, and the impact of each strategy on your overall returns.
Asset type allocation
This provides a clear overview of how your portfolio is split between euros, cryptocurrencies, and stablecoins.
It helps you assess your exposure to volatility and balance between stable and high-risk assets, supporting more informed planning and risk management.
Further reading:
- Managing performance with the P&L feature
- Definitions of realised, unrealised profit and average purchase price
- Profit and Loss: how to read the Analytics section
- Profit and Loss: how profit/loss calculation works
The updated P&L method on Young Platform marks a significant step forward in managing crypto investments with clarity and accountability. It enhances real-time performance tracking while integrating seamlessly with fiscal reporting, simplifying your annual tax process.Whether you’re a seasoned investor or just getting started, you now have a powerful tool to monitor, evaluate and document your crypto activity in a clear, structured, and compliant way.


