Smart trades are algorithmic trading strategies. This article will examine the types available on Young Platform and how they work.
Algorithmic trading in brief
Imagine algorithmic trading as the use of an autopilot for trading. Just like the autopilot of a plane or Tesla, it follows precise instructions to take us to our destination. In algorithmic trading, software acts according to well-defined rules (the algorithm) to buy or sell assets such as stocks, bonds or cryptocurrencies. Smart trades work this way, thanks to their algorithms.
The advantages of algorithmic trading
The main advantage lies in eliminating emotional and psychological influences that determine human decisions, using a cold, logical approach to data instead. Unlike us, the algorithm never rests: it scans the data and the market 24/7, even while we sleep.
Algorithmic Trading on Young Platform
The algorithm, in itself, acts according to rules. Each algo-trading strategy available on Young Platform has its specific algorithm, built on an ‘indicator’.
Indicators work like ‘sensors’ that try to understand what will happen once they have analysed the data. Based on the result, the algorithm executes a buy or sell order. It is essential to remember that indicators analyse statistical trends and are therefore not infallible. This is because the market is unpredictable, and no one, not even mathematics, can predict the future.
Smart Trades available
Let’s, therefore, take a look at the strategies available on Young Platform and their respective indicators:
Discover on Young Platform
Each Smart Trade can be activated on one of the following cryptocurrencies:
NB. The following definitions have been greatly simplified to make them accessible to a non-expert audience. To explore the indicators, please read the in-depth analyses of the Academy below. Also, remember that the information below, including that in the summary tables, is not a magic formula. Financial markets are complex and unpredictable, and the performance of an indicator can vary depending on many factors.
Before proceeding, consider your risk profile, investment objectives and time horizon. Also, do not base your decisions on a single source of information; always consult a professional who can help you base your choices. In this table, you will find some information that may help you research. But don’t forget: the final decision is always yours!
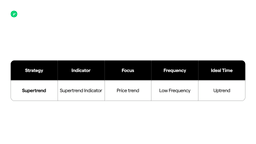
Supertrend
This strategy takes its name from the indicator on which it was built: the Super Trend Indicator. In a nutshell, it works on short-term volatility by trying to identify price trend reversals.
A trend reversal, also called a price reversal, is a change in the direction of prices. The prices of a specific asset are hitherto oriented in a particular direction, and they change direction. There are downward reversals and upward reversals. The trend changes from positive to negative in the first case, while the opposite occurs in the second case.
The dedicated guide includes other ranking parameters to help you assess whether this strategy is right for you.
Keltner Channels
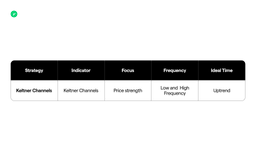
The Keltner Channel was first introduced by Chester Keltner in the 1960s. This indicator mainly studies price strength.
The Keltner Channels help identify potential entry and exit points in an upward market. They tend to work best in high volatility, i.e., when an asset’s price moves steadily. Conversely, if the price remains stable, it may suggest a less volatile or consolidating market.
The dedicated guide includes other ranking parameters to help you assess whether this strategy is right for you.
Momentum
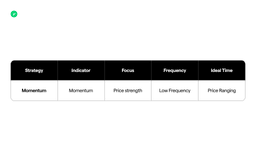
This indicator is a tool that helps analyse markets to understand whether the price of an axis is getting stronger or weaker. It tells us whether the price is rising rapidly, falling, or changing slowly. This indicator mainly uses two indices: the Relative Strength Index (RSI), which helps to tell if a stock has been bought or sold too much compared to its ‘normal’ value, and the Moving Average Convergence Divergence (MACD), which shows if the price trend of an asset is changing.
The dedicated guide includes other ranking parameters to help you assess whether this strategy is right for you.
Bollinger Bands
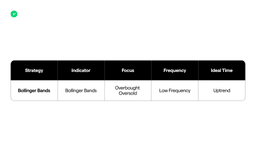
The Bollinger Bands strategy, named after its indicator, operates based on ‘buy walls’ and ‘sell walls’. It comes into play when the price enters an ‘overbought’ or ‘oversold’ zone.
In the first case, a cryptocurrency is traded at a price the index evaluates as higher than the “fair” price. Therefore, it is expected that the market will correct shortly, and consequently, there will be a decrease in the value of the cryptocurrency. In the second case, the index believes that the cryptocurrency is traded at a price below its “fair” value. Thus, it is likely that the price will bounce back up.
Other classification parameters in the dedicated guide can help you evaluate whether this strategy is right for you.
How to activate a strategy on Young Platform
Now that we have identified one or more strategies suited to our needs, it is time to get into the swing of things and follow the step-by-step tutorial to activate them. We have devoted an article to the Smart Trades activation guide. In addition, you can read the article on Frequently Asked Questions about Smart Trades.

Young Platform does not provide tax, investment or financial services and advice. The information on this website is provided for informational purposes only and is presented without regard to any specific investor’s investment objectives, risk appetite, or financial circumstances. It may not be suitable for all investor users. Buying and selling cryptocurrencies involves risks, including total loss of capital. Users should always research, consult a qualified professional before deciding, and carefully assess their risk profile and loss tolerance.
